Tutorials: HTML/CSS/JS | Leaflet | D3 | Visualizing spatial-temporal data 1 | Visualizing spatial-temporal data 2
Ningchuan Xiao
The goals of this workshop include
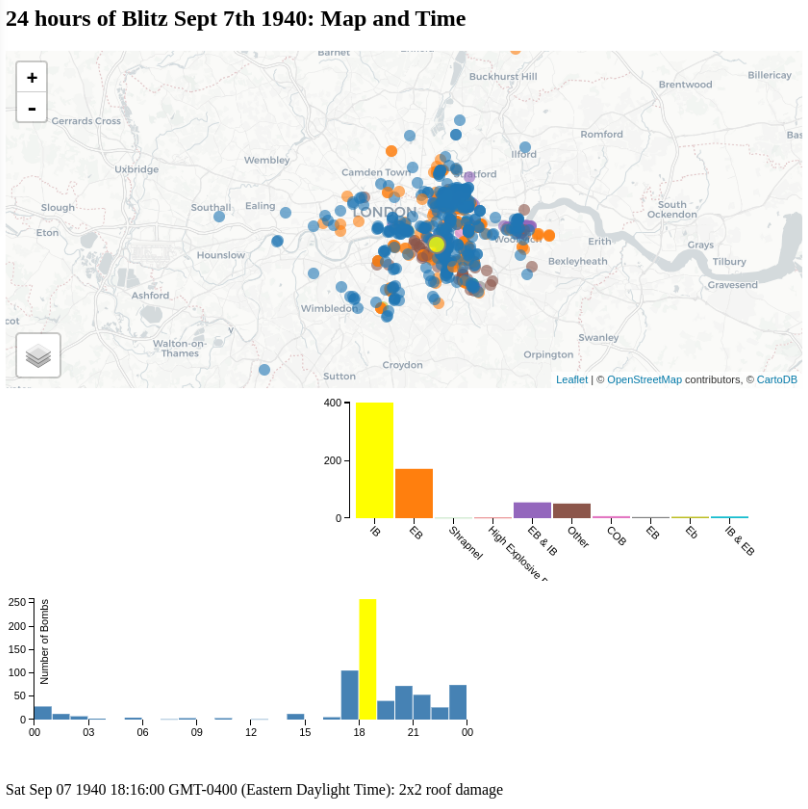
We are going to use the data of 24 hours of Blitz (bombing of London) on September 7, 1940. The data source is http://bombsight.org/data/sources/. A former student, Maxfield Barach, has geocoded the original data and reported that only 708 of the 843 bomb sights can be geocoded. My further clean-up of the data found that only 706 were good. This data is saved in a tab separated file (TSV) and the first three lines are like this:
order	time	location	type	details	lng	lat
1	0:08	43 Southwark Park Road, SE16, London, UK	IB	Grocers: 3x2 roof damaged	-0.068463	51.494531
2	0:10	49 Southwark Park road, Bermondsey, SE16, London, UK	IB	Bakers: 3x2 roof damaged	-0.058463	51.494532
The link to this file is here.
We first need to write the following HTML file. Let's call it bombs5.html. Note that in addition to what we have used so far, a new library is used here. It is the jquery library and we will use its inArray function to test if a value is in an array.
<!DOCTYPE html>
<html lang="en">
    <head>
        <meta charset="utf-8">
        <style>
            #map { height: 350px; }

            .axis path,
            .axis line {
                fill: none;
                stroke: black;
                shape-rendering: crispEdges;
            }

            .bar {
                shape-rendering: crispEdges;
            }

            .axis text {
                font-family: sans-serif;
                font-size: 11px;
            }

            .x.axis path {
                display: none;
            }

        </style>

        <title>D3 Test</title>

        <link rel="stylesheet" href="https://unpkg.com/leaflet@1.0.0-rc.3/dist/leaflet.css" />
        <script src="https://unpkg.com/leaflet@1.0.0-rc.3/dist/leaflet.js"></script>
        <script src="http://d3js.org/d3.v3.min.js"></script>
        <script src="https://code.jquery.com/jquery-3.0.0.min.js"></script>

    </head>
    <body>
        <h2>24 hours of Blitz Sept 7th 1940: Map and Time</h2>
        <div id="map"></div>
        <div style="float:right" id="bombstype"></div>
        <div id="timehisto"></div>

        <script src="bombs5.js" type="text/javascript"></script>

        <div id="debug"></div>
    </body>
</html>
Now as indicated in the above HTML file, we write the javascript file called bombs5.js.
// This is where we put the good stuff using D3
// Data source: http://bombsight.org/data/sources/
// 24 hours of Blitz Sept 7th 1940
var bombs_data;
var bombs_geojson;
var hourBins;
var layer_geojsons = {};
var svg;
var rects;
var map;
var bombs_layer;
var bombs_types = {};
var bombs_types_array;
var cat_keys;
var cat_svg;
var cat_rects;
var c10;
var histData;
//
// TODO: ll_ids needs to be handled as ll_ids2
// This will enable highlighting type barchart when hovering on time chart
//
var ll_ids;
var ll_ids2 = {}; // ids linked to the barchart: barchart id -> time chart ids, layer ids.
var parseTime = d3.time.format("%B %d, %Y %I:%M %Z").parse;
var bisectTime = d3.bisector(function(d) { return d; }).left;
var default_bombs_style = {
color: "none",
radius: 6,
fillColor: "steelblue",
opacity: 1,
fillOpacity: 0.6,
weight: 0
};
var highlight_bombs_style = {
fillColor: 'yellow',
color: "grey",
fillOpacity: 0.8,
weight: 2
}
d3.tsv("bombs.tsv", handle_bombs);
function handle_bombs(error, data) {
bombs_geojson = {
"type": "FeatureCollection",
"features": []
};
data.forEach(function(d, i) {
d.id = i;
d.order = +d["order"];
d.lng = +d.lng;
d.lat = +d.lat;
d.type = (d.type=="-"?"Other":d.type);
d.time = parseTime("September 7, 1940 " + d.time + " -0400");
bombs_geojson.features[i] = {
"type": "Feature",
"geometry": {
"type": "Point",
"coordinates": [d.lng, d.lat]
},
"properties": {
"id": i
}
};
if (d.type in bombs_types) {
bombs_types[d.type] += 1;
}
else {
bombs_types[d.type] = 1;
}
});
bombs_data = data;
cat_keys = Object.keys(bombs_types);
bombs_types_array = cat_keys.map(function(v) { return [v, bombs_types[v]]; });
cat_keys.forEach(function(d, i) {
ll_ids2[d] = {
layer_ids: [],
time_ids: []
};
});
c10 = d3.scale.category10().domain(cat_keys);
make_timechart();
make_barchart();
make_maps();
}
function make_barchart() {
var total_w = 500;
var total_h = 200;
var margin = {top: 15, right: 20, bottom: 50, left: 30};
var w = total_w - margin.left - margin.right;
var h = total_h - margin.top - margin.bottom;
cat_svg = d3.select("#bombstype")
.append("svg")
.attr("width", w + margin.left + margin.right)
.attr("height", h + margin.top + margin.bottom);
var yScale = d3.scale.linear().
domain([0, d3.max(bombs_types_array, function(d) { return d[1]; })]).
range([h, margin.top]);
var yAxis = d3.svg.axis()
.scale(yScale)
.orient("left")
.ticks(3);
xScale = d3.scale.ordinal()
.domain(bombs_types_array.map(function(d) { return d[0]; }))
// .domain(keys)
.rangeRoundBands([margin.left, w], 0.05);
xAxis = d3.svg.axis()
.scale(xScale)
.orient("bottom");
cat_rects = cat_svg.selectAll("rect")
.data(bombs_types_array)
.enter()
.append("rect")
.attr("class", "barchart")
.attr("x", function(d, i) {return xScale(d[0]);})
.attr("y", function(d) {return yScale(d[1]);} )
.attr("height", function(d) {return h-yScale(d[1]);})
.attr("width", xScale.rangeBand())
.attr("fill", function(d, i) {return c10(d[0]);});
cat_rects.on("mouseover", function(d, i) {
d3.select(this).style('fill', 'yellow');
d3.select("#debug").html("over: " + d + ", " + i);
bombs_layer.eachLayer(function (layer) {
layer.setStyle({fillColor :'#afafaf'})
});
ll_ids2[d[0]].layer_ids.forEach(function(dd) {
l = bombs_layer.getLayer(dd);
bombs_layer.resetStyle(l);
if (!L.Browser.ie && !L.Browser.opera) {
l.bringToFront();
}
});
d3.selectAll(".timechart")
.filter(function(dd, ii) {return ($.inArray(ii, ll_ids2[d[0]].time_ids)!=-1); })
.style("fill", highlight_bombs_style["fillColor"]);
})
.on("mouseout", function(d, i) {
d3.select(this).style("fill", function(d, i) {return c10(d[0]);});
bombs_layer.eachLayer(function (layer) {
bombs_layer.resetStyle(layer);
});
d3.selectAll(".timechart")
.filter(function(dd, ii) {return ($.inArray(ii, ll_ids2[d[0]].time_ids)!=-1); })
.style("fill", default_bombs_style["fillColor"]);
})
cat_svg.append("g")
.attr("class", "axis")
.attr("transform", "translate(" + margin.left + "," + 0 +")")
.call(yAxis);
cat_svg.append("g")
.attr("class", "x axis")
.attr("transform", "translate(0," + h + ")")
.call(xAxis)
.selectAll("text")
.attr("y", 5)
.attr("x", 5)
.attr("transform", "rotate(45)")
.style("text-anchor", "start");
}
function make_timechart() {
var total_w = 500;
var total_h = 200;
var margin = {top: 15, right: 20, bottom: 60, left: 30};
var w = total_w - margin.left - margin.right;
var h = total_h - margin.top - margin.bottom;
var formatTime = d3.time.format("%H");
var hourExtent = d3.extent(bombs_data, function(d) { return d.time; });
// one bin per hour, for 24 hours in the day
hourBins = d3.time.hours(d3.time.hour.offset(hourExtent[0],-1),
d3.time.hour.offset(hourExtent[1],1));
// a function to bin the data
var binByHour = d3.layout.histogram()
.value(function(d) { return d.time; })
.bins(hourBins);
// construct the data for histogram
histData = binByHour(bombs_data);
histData.forEach(function(d, i) {
d.forEach(function(dd, ii) {
if ($.inArray(i, ll_ids2[dd.type].time_ids) == -1)
// if (! (i in ll_ids2[dd.type].time_ids))
ll_ids2[dd.type].time_ids.push(i);
});
});
var svg = d3.select("#timehisto")
.append("svg")
.attr("width", w + margin.left + margin.right)
.attr("height", h + margin.top + margin.bottom)
.append("g")
.attr("transform", "translate(" + margin.left + "," + margin.top + ")");
var x = d3.time.scale().domain(d3.extent(hourBins)).range([0, w]);
var xAxis = d3.svg.axis().scale(x).orient("bottom").tickFormat(formatTime);
var y = d3.scale.linear().domain([0, d3.max(histData, function(d) { return d.y; })]).range([h, 0]);
var yAxis = d3.svg.axis().scale(y).orient("left").ticks(6);
rects = svg.selectAll("rect")
.data(histData)
.enter()
.append("rect")
.attr("class", "timechart")
.style("fill", default_bombs_style["fillColor"])
.attr("x", function(d) { return x(d.x); })
.attr("width", function(d) { return x(new Date(d.x.getTime() + d.dx))-x(d.x)-1; })
.attr("y", function(d) { return y(d.y); })
.attr("height", function(d) { return h - y(d.y); });
rects.on("mouseover", function(d, i) {
d3.select(this).style("fill", highlight_bombs_style["fillColor"]);
d3.select("#debug").html("over: " + d.length + " " + d + ", " + i);
bombs_layer.eachLayer(function (layer) {
layer.setStyle({fillColor :'#ababab'})
});
ll_ids[i].forEach(function(dd) {
bombs_layer.resetStyle(bombs_layer.getLayer(dd));
l = bombs_layer.getLayer(dd);
if (!L.Browser.ie && !L.Browser.opera) {
l.bringToFront();
}
});
})
.on("mouseout", function(d, i) {
d3.select(this).style("fill", default_bombs_style["fillColor"]);
d3.select("#debug").html("OUT: " + d.length + " " + d[0]["id"] + ", " + i);
bombs_layer.eachLayer(function (layer) {
bombs_layer.resetStyle(layer);
});
});
svg.append("g")
.attr("class", "x axis")
.attr("transform", "translate(0," + h + ")")
.call(xAxis);
svg.append("g")
.attr("class", "y axis")
.call(yAxis)
.append("text")
.attr("transform", "rotate(-90)")
.attr("y", 6)
.attr("dy", ".71em")
.style("text-anchor", "end")
.text("Number of Bombs");
}
function onEachBombsFeature(feature, layer) {
// find the bin that contains this point and push the id to ll_ids
id = L.stamp(layer);
i = bisectTime(hourBins, bombs_data[feature.properties.id].time) - 1;
ll_ids[i].push(id);
ll_ids2[bombs_data[feature.properties.id].type].layer_ids.push(id);
layer.on({
mouseover: function(e) {
var layer = e.target;
feature = layer.feature;
feature_id = feature.properties.id;
var t = bombs_data[feature_id].time;
var cat = bombs_data[feature_id].type;
// highlight more on self
layer.setStyle(highlight_bombs_style);
layer.setStyle({
radius: default_bombs_style["radius"]+3
});
if (!L.Browser.ie && !L.Browser.opera) {
layer.bringToFront();
}
d3.select("#debug").html(t + ": " + bombs_data[feature_id].details);
d3.selectAll("rect")
.filter(function(d, i) {dt=t-d.x; return (d[0]==cat || (dt < d.dx && dt>=0)); })
.style("fill", highlight_bombs_style["fillColor"]);
},
mouseout: function(e) {
bombs_layer.resetStyle(e.target);
var t = bombs_data[feature_id].time;
var cat = bombs_data[feature_id].type;
hist_index = bisectTime(hourBins, t) - 1;
ll_ids[hist_index].forEach(function(dd) {
bombs_layer.resetStyle(bombs_layer.getLayer(dd));})
d3.selectAll(".timechart")
.filter(function(d, i) {dt=t-d.x; return (dt < d.dx && dt>=0); })
// .filter(function(d, i) {dt=t-d.x; return (dt < d.dx && dt>=0); })
.style("fill", "steelblue");
d3.selectAll(".barchart")
.filter(function(d, i) {dt=t-d.x; return (d[0]==cat); })
// .filter(function(d, i) {dt=t-d.x; return (dt < d.dx && dt>=0); })
.style("fill", c10(cat));
}
})
}
function make_maps() {
map = L.map('map');
map.setView([51.5, -0.1], 10);
// create an OpenStreetMap tile layer
var osmMapnik = L.tileLayer('http://{s}.tile.openstreetmap.org/{z}/{x}/{y}.png', {
attribution: '© <a href="http://osm.org/copyright">OpenStreetMap</a>contributors'
});
// create another layer using the cartodb service
var cartoLight = L.tileLayer("https://cartodb-basemaps-{s}.global.ssl.fastly.net/light_all/{z}/{x}/{y}.png", {
attribution: '© <a href="http://www.openstreetmap.org/copyright">OpenStreetMap</a> contributors, © <a href="https://cartodb.com/attributions">CartoDB</a>'
});
var baseMaps = {
"Street map light": cartoLight,
"OpenStreetMap": osmMapnik
};
var layersControl = new L.Control.Layers(baseMaps, null, {collapsed: true, position: 'bottomleft'});
map.addControl(layersControl);
map.addLayer(cartoLight, true);
ll_ids = []; // leaflet layer ids, very important
for (i=0; i<histData.length; i++)
ll_ids[i] = [];
bombs_layer = L.geoJson(bombs_geojson, {
pointToLayer: function (feature, latlng) {
return L.circleMarker(latlng);
},
style: function (feature) {
c = c10(bombs_data[feature.properties.id].type);
s = Object.create(default_bombs_style); // make a deepcopy, not a reference
s["fillColor"] = c;
return s;
},
onEachFeature: onEachBombsFeature
});
bombs_layer.addTo(map);
layersControl.addOverlay(bombs_layer, "Bombs");
}
The result should look like the following screenshot:
Any more improvements we can do to make the web app better?